How Pro-Torque improved pipeline design with QLA Utility Mapping

Geospatial & DigitalUnderground Utility Mapping

PROJECT OVERVIEW

Class A utility mapping and integrated geospatial data to support a new pipeline route in Kewdale, WA.

When Pro-Torque set out to design a path for a new proposed pipeline in Kewdale, they needed more than just a list of what was underground. The team required precise positional data, above and below ground, to make confident design decisions and avoid costly clashes during construction.

RM Surveys was engaged to deliver a comprehensive utility mapping solution, combining Class A locating across all utilities with integrated geospatial data to produce a single, coordinated dataset. 

The project involved both RM Surveys’ Utility Mapping (UM) and Geospatial teams, and included mapping of critical assets. We worked through a live traffic environment, coordinating with asset owners and local council to complete the full scope safely and on time.

INTEGRATED SPATIAL DATA FOR PIPELINE PLANNING

WHAT WE DELIVERED

CLASS A UTILITY MAPPING
ABOVE AND BELOW GROUND FEATURE SURVEY
GEOSPATIAL DATA INTEGRATION
PIPELINE CLASH VISUALISATION

TURNING DATA INTO DESIGN

PROJECT OUTCOMES

When utility data relies on existing records alone, positional tolerances can vary significantly,  leaving design teams working with uncertainty rather than fact.

RM Surveys applied Quality Level A (QLA) survey methods to reduce positional tolerance to +/-50mm, giving Pro-Torque a dataset accurate enough to support detailed design with confidence.

Integrated above and below ground data

RM Surveys delivered a single, sign-coordinated dataset combining underground utility mapping with geospatial survey. It removed the gap between ‘what’s underground’ and ‘where everything sits spatially’, presenting the full picture in one usable deliverable. The data was showcased directly in Pro-Torque’s main office and was well received by all stakeholders.

Positional tolerance reduced to +/-50mm

By applying QLA methods, RM Surveys reduced positional tolerance to ±50mm, compared to standard records which can carry tolerances of ±300mm to ±500mm. The result: a dataset stakeholders could rely on for design decisions involving critical infrastructure.

Clash detection for the proposed pipeline route

RM Surveys incorporated the proposed pipeline route directly into the integrated dataset. This allowed the design team to identify clash points based on the target installation depth, flagging potential conflicts with existing services before any ground was broken.

3D data ready for major infrastructure planning

The final deliverable was structured for immediate use in workflows. Pro-Torque can draw on the 3D integrated dataset to inform current and future infrastructure planning decisions on site.

Delivered ahead of schedule

Despite working through complex stakeholder approvals, live traffic environments and coordination with local council and asset owners, the project was completed ahead of schedule with minimal site disturbance.

“Pro-Torque had the pleasure of working with Rhyce Murphy, Utility Mapping
Manager, on a pipeline project in Kewdale.

His technical knowledge and level of job preparation were second to none. The
project was delivered to a high standard, and stakeholders were extremely satisfied
with the quality of the final deliverable.

We look forward to working with Rhyce and the RM Surveys team on future
projects”

Travis Hudson, Director - Pro-Torque

It was a great experience from client meetings prior to contract engagement,

through to completion. The job was completed ahead of schedule, with minimal
disturbance.

Rhyce Murphy, Utility Mapping Manager - RM Surveys
Background Image

TECHNICAL DELIVERABLES

High-accuracy, directly usable data delivered in a single coordinated format. 

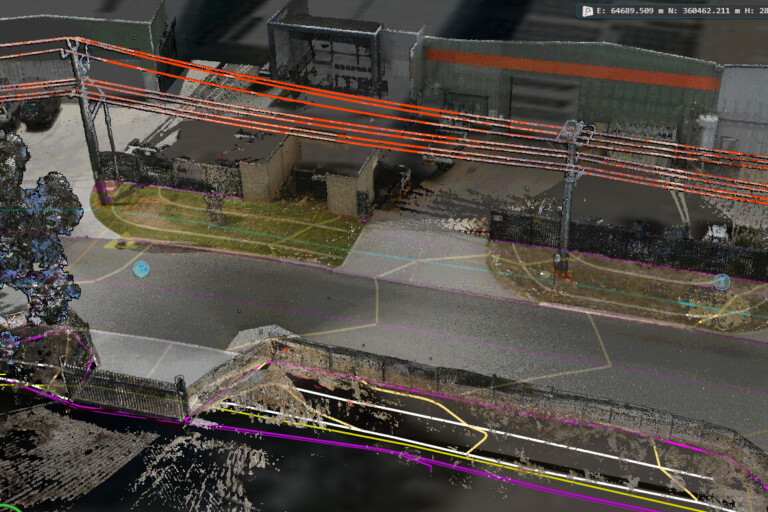
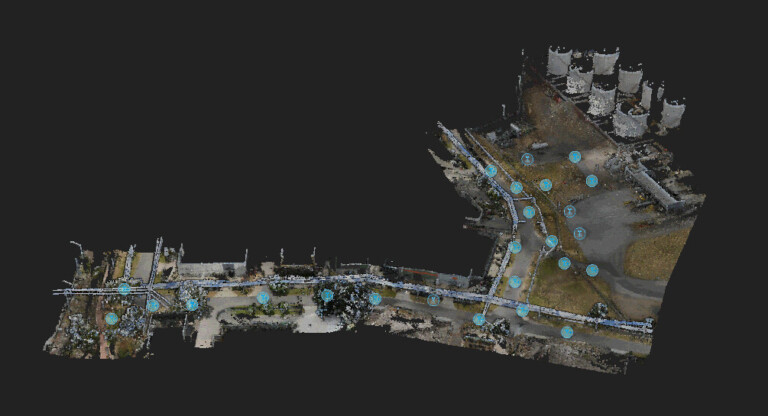
RM Surveys delivered a complete, integrated spatial dataset combining Class A utility mapping with geospatial survey data, structured for direct use in design, construction and asset management.

Deliverables included:

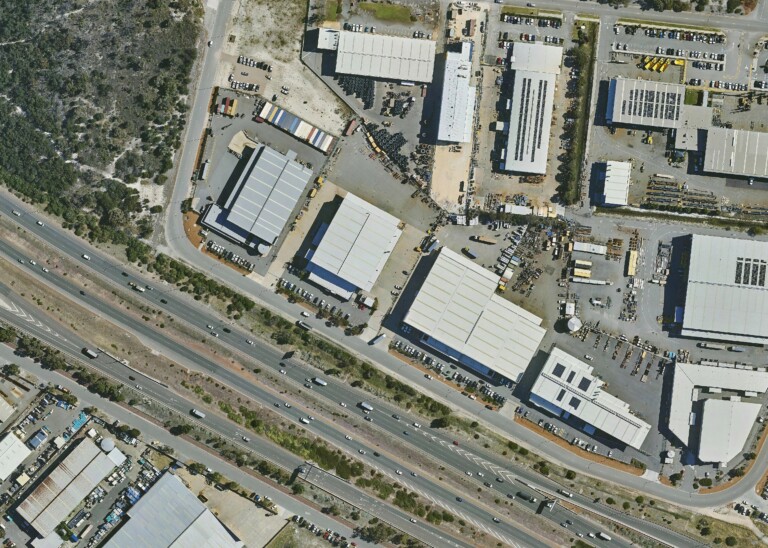
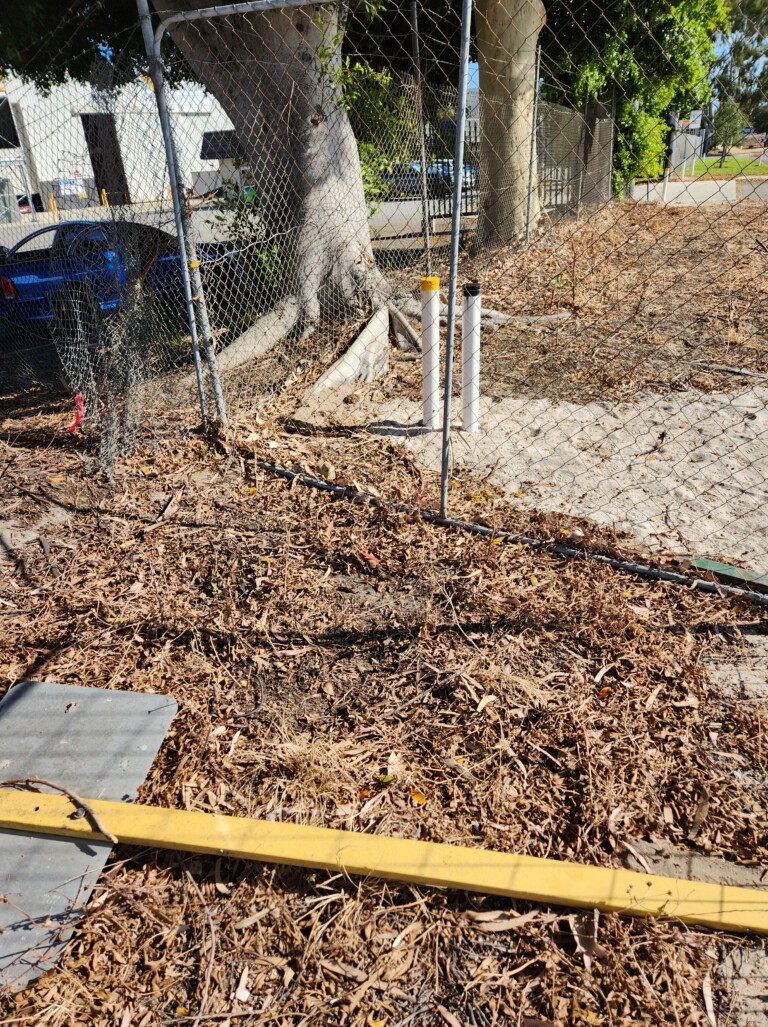
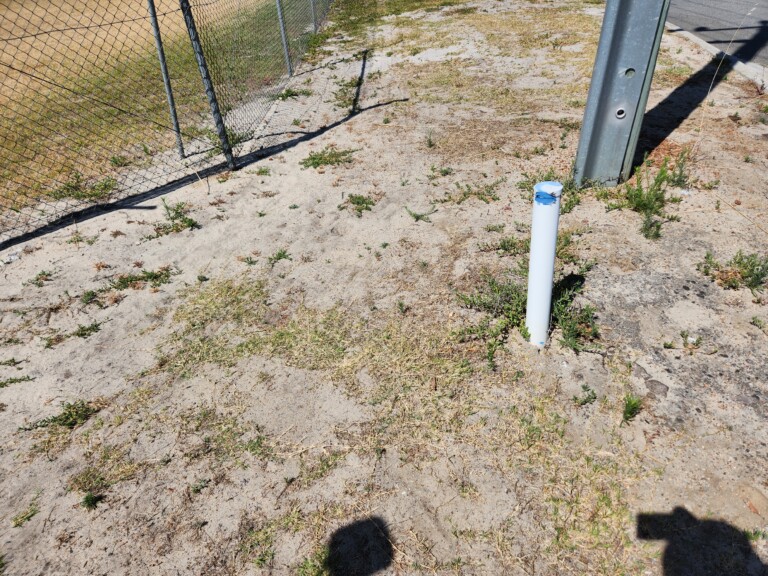
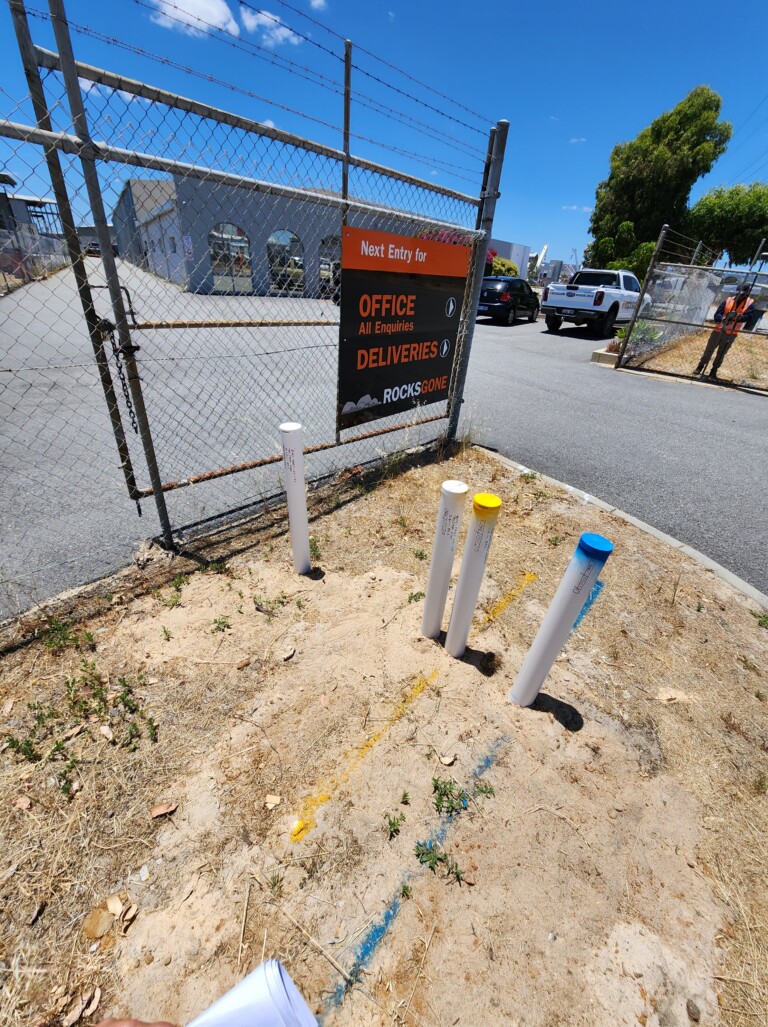
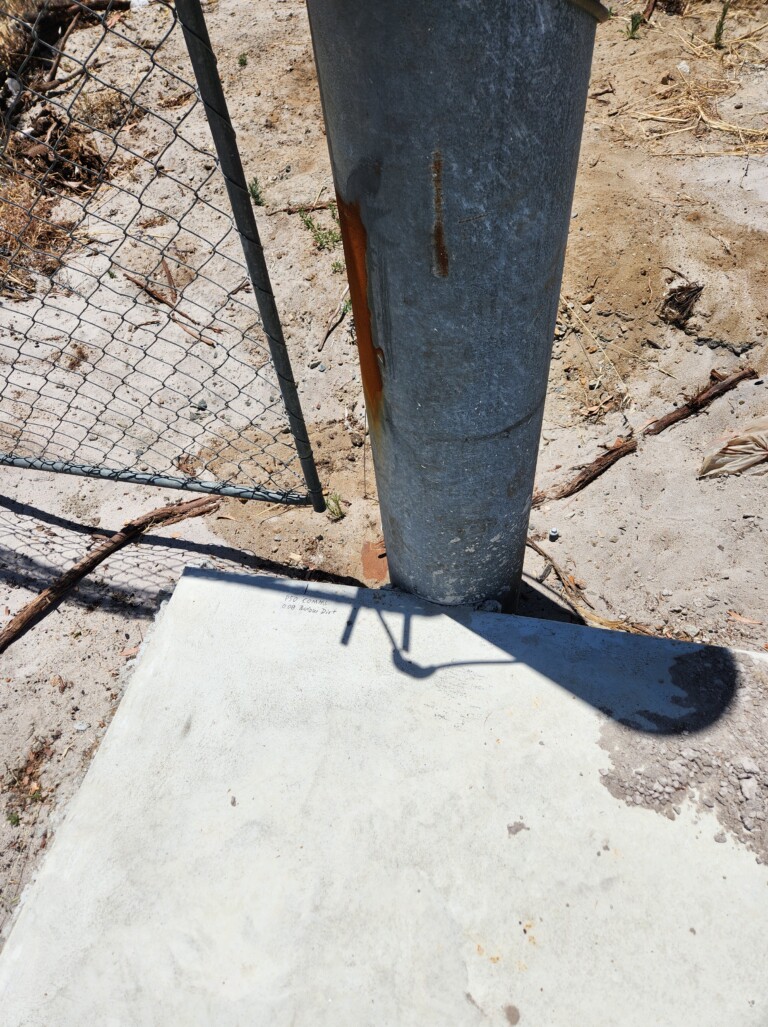
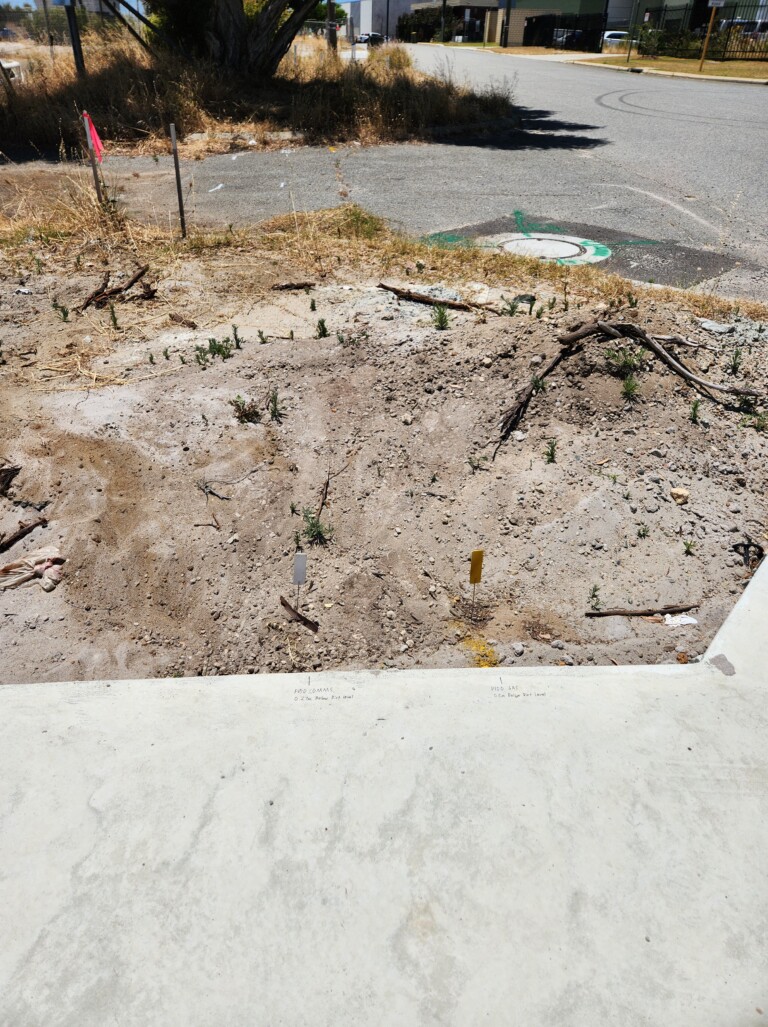
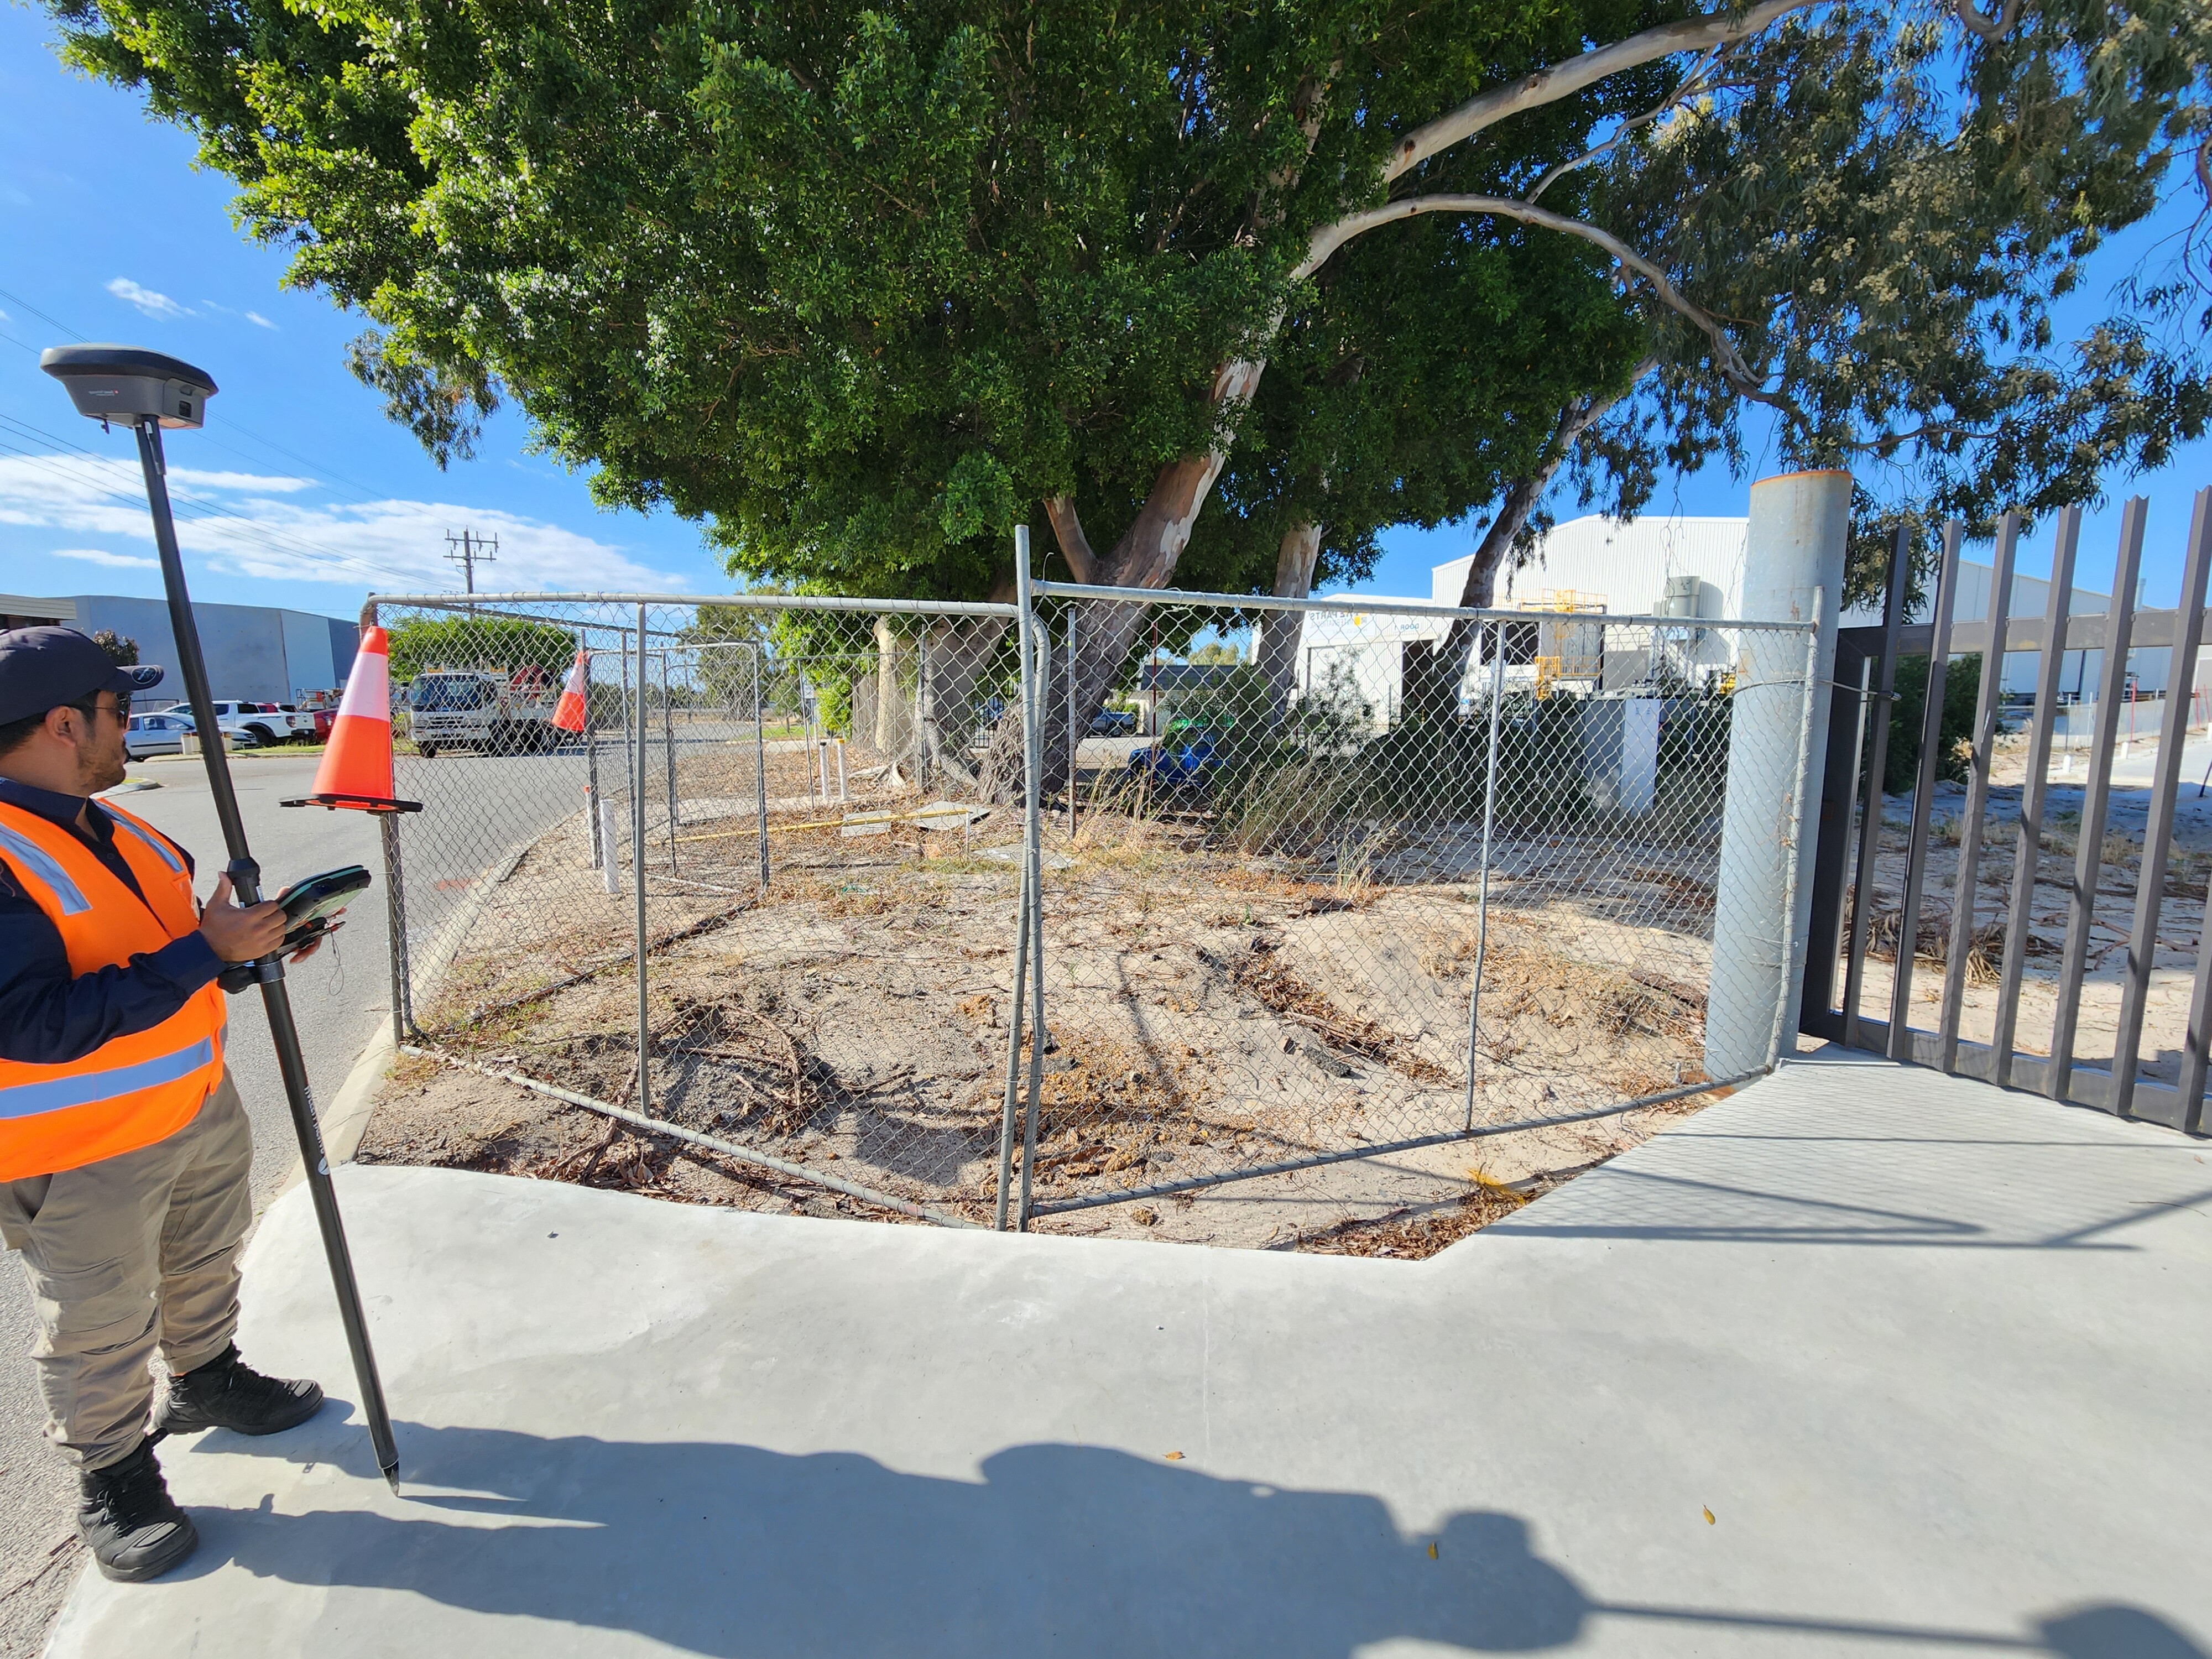
  • Class A (QLA) locating of all underground utilities, including important infrastructure in the Kewdale area
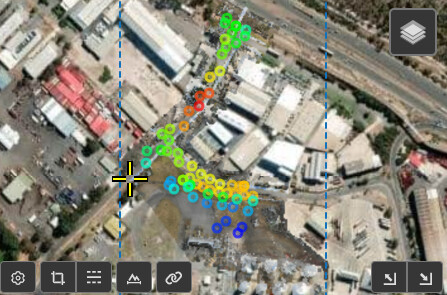
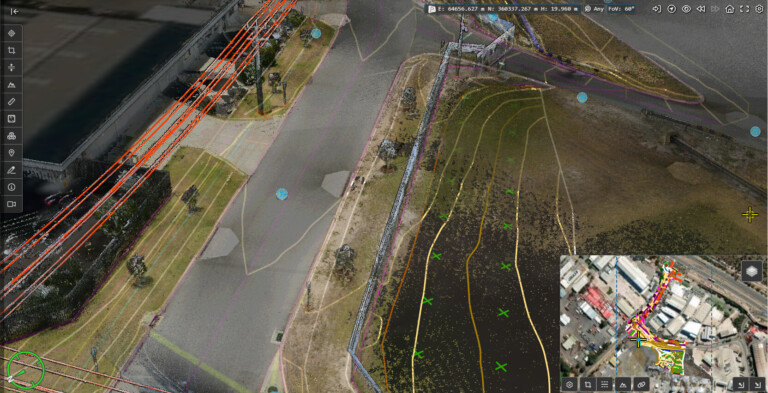
  • Above and below ground features captured in a single, sign-coordinated dataset
  • Positional data accurate to ±50mm, a significant reduction from standard tolerance levels of ±300mm to ±500mm
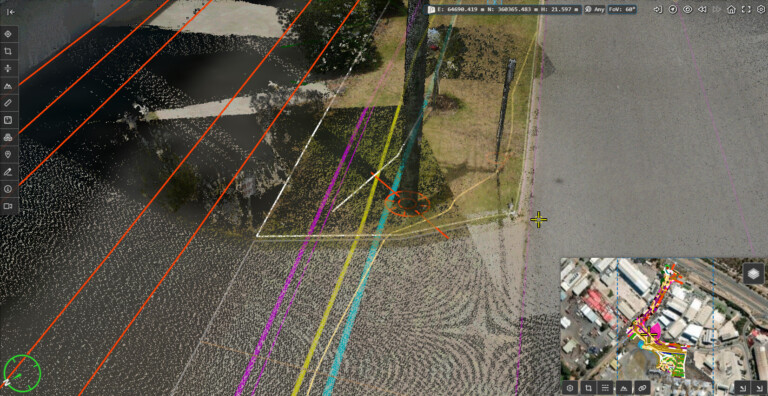
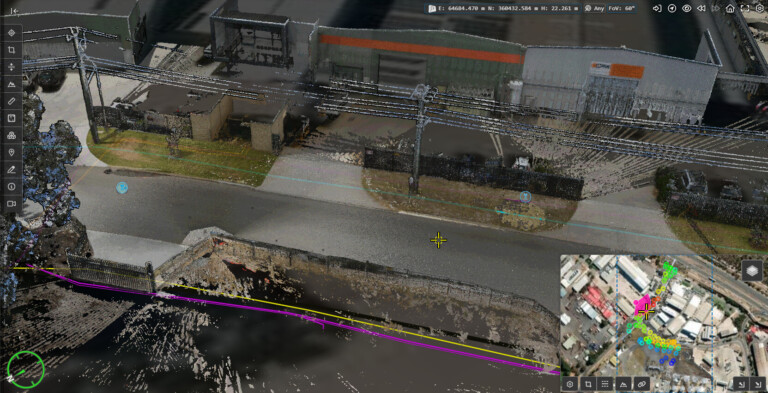
  • Proposed pipeline route incorporated into the dataset with clash point analysis at the target installation depth
  • Final deliverable formatted for direct use in design software and asset management workflows

All data was provided in a format suitable for design coordination, stakeholder presentation and ongoing infrastructure planning.

Other Projects

View all projects
project image
1

Perth Zoo Gibbon Crossing: Spatial Data For Elevated Habitat Design

RM Surveys proudly supported the design and delivery of Perth Zoo’s Gibbon Crossing- Australia’s first immersive gibbon habitat, officially opened in June 2025. This exhibit is part of Perth Zoo’s $51 million Master Plan focused on species-first design.

We were engaged to deliver early-stage spatial data to inform design and construction. Our Geospatial and Utility Mapping (UM) teams captured accurate, high-resolution data in a high-traffic, sensitive environment. Tree height and canopy spread were especially critical to ensure habitat safety and functionality.

View more
project image
2

Surveying the Elizabeth Quay Pedestrian Bridge

The Elizabeth Quay Pedestrian Bridge is one of the centrepieces of the new precinct connecting Perth City to the Swan River.

With RM Surveys’ experience in the fabrication and erection of steel structures, they were chosen as the project surveyors for the construction and erection of this complex and visually stunning structure.

View more
project image
3

How RM Surveys Helped Avoid a Factory Return for a Damaged Pilatus Jet

In October 2025, RM Surveys was engaged at Adelaide Airport to support the repair of a damaged Pilatus private jet. The aircraft had sustained structural damage around the rudder assembly.

The manufacturer needed to assess whether the rudder axis alignment could be verified and corrected in situ, rather than returning the aircraft to the factory for validation on a factory jig. This had not been attempted before on this aircraft type.

The objective was to confirm the rudder alignment to factory tolerances on-site, remove the need for a return to the manufacturer, and reduce downtime so the aircraft could get back in the air quickly.

View more